Finite element simulation of heat transfer based on CT image
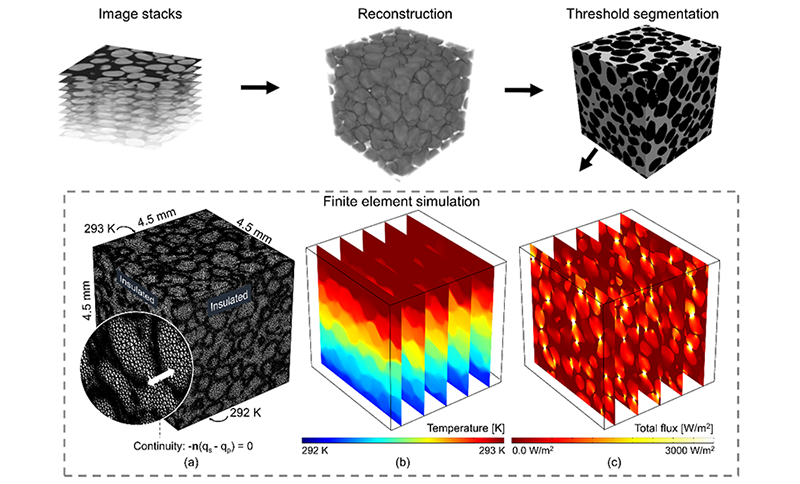
A representative element volumes (REVs) of dimensions 4.55 × 4.55 × 4.55 mm (320 grains in Ottawa sand as an example) was selected from the CT images. As shown in Fig. 1, the geometry of a REV was reconstructed based on these CT images. The solid and pore phases were then split using the widely accepted Otsu threshold segmentation. The thermal conductivity of the solid used in this paper was 3 W/(m K), while that of air in the pore spaces was taken as 0.025 W/(m K). Reconstruction and segmentation were completed using Simpleware ScanIP with a further meshing step. The mesh was then imported to a FEM software application called COMSOL Multiphysics to simulate heat transfer.

Fig.1 The process of heat transfer simulation based on CT scanned images
In COMSOL Multiphysics, the boundary temperature at the top Ta was prescribed as 293 K, while that on the bottom Tb was 292 K to create a thermal gradient to drive heat flux (a different thermal gradient would render similar results), and the other boundary surfaces were insulated (i.e., nil heat flux). Next, the temperature distribution was computed by solving the governing energy balance equations. Since dry sands were tested using a thermal needle, the simulation model only considered heat conduction. Fourier’s law was used to calculate the conductive heat flux, and a continuity equation was applied to ensure flux continuity at the particle-pore interface. An example of the temperature and flux distribution is shown in Fig. 1. Based on the solutions for the heat flux at the top (inlet) and bottom (outlet) boundaries, the ETC at the two surfaces was calculated using Equation 1. The mean ETC at the two boundaries was regarded as the ETC of the whole sample:
λeff = (1/A ∫AQzdA)L/(Ta-Tb) (1)
where λeff (W/mK) is the ETC of the sample, A (m2) is a typical cross-sectional area, L(m) is the height of the packing, Ta = 293 K and Tb = 292 K are boundary temperatures at the top and bottom of the sample respectively, and Qz(W/m2) is the vertical heat flux at a typical cross-section.
Please cite our relevent papers
